Doom E1M1, rendered by GROUP BY. Every frame is one analytical SQL query — scan millions of voxel-surface observations, clip them to the camera frustum, reduce to the nearest visible surface per ray, shade the result in a terminal. Same query, same WAD geometry, replayed across every engine.
This is not a claim that databases should be game engines. It is a latency-shaped, row-returning workload — the exact inverse of ClickBench — built to expose fixed per-query overhead that aggregate benchmarks structurally cannot see. It works: see “what the weird benchmark caught” below.
22.5 fpsauto-router, 5M-row world
5M → 200Mworld sizes, same tour
byte-identicalframe hash on every engine
DoomQL
How a frame happens
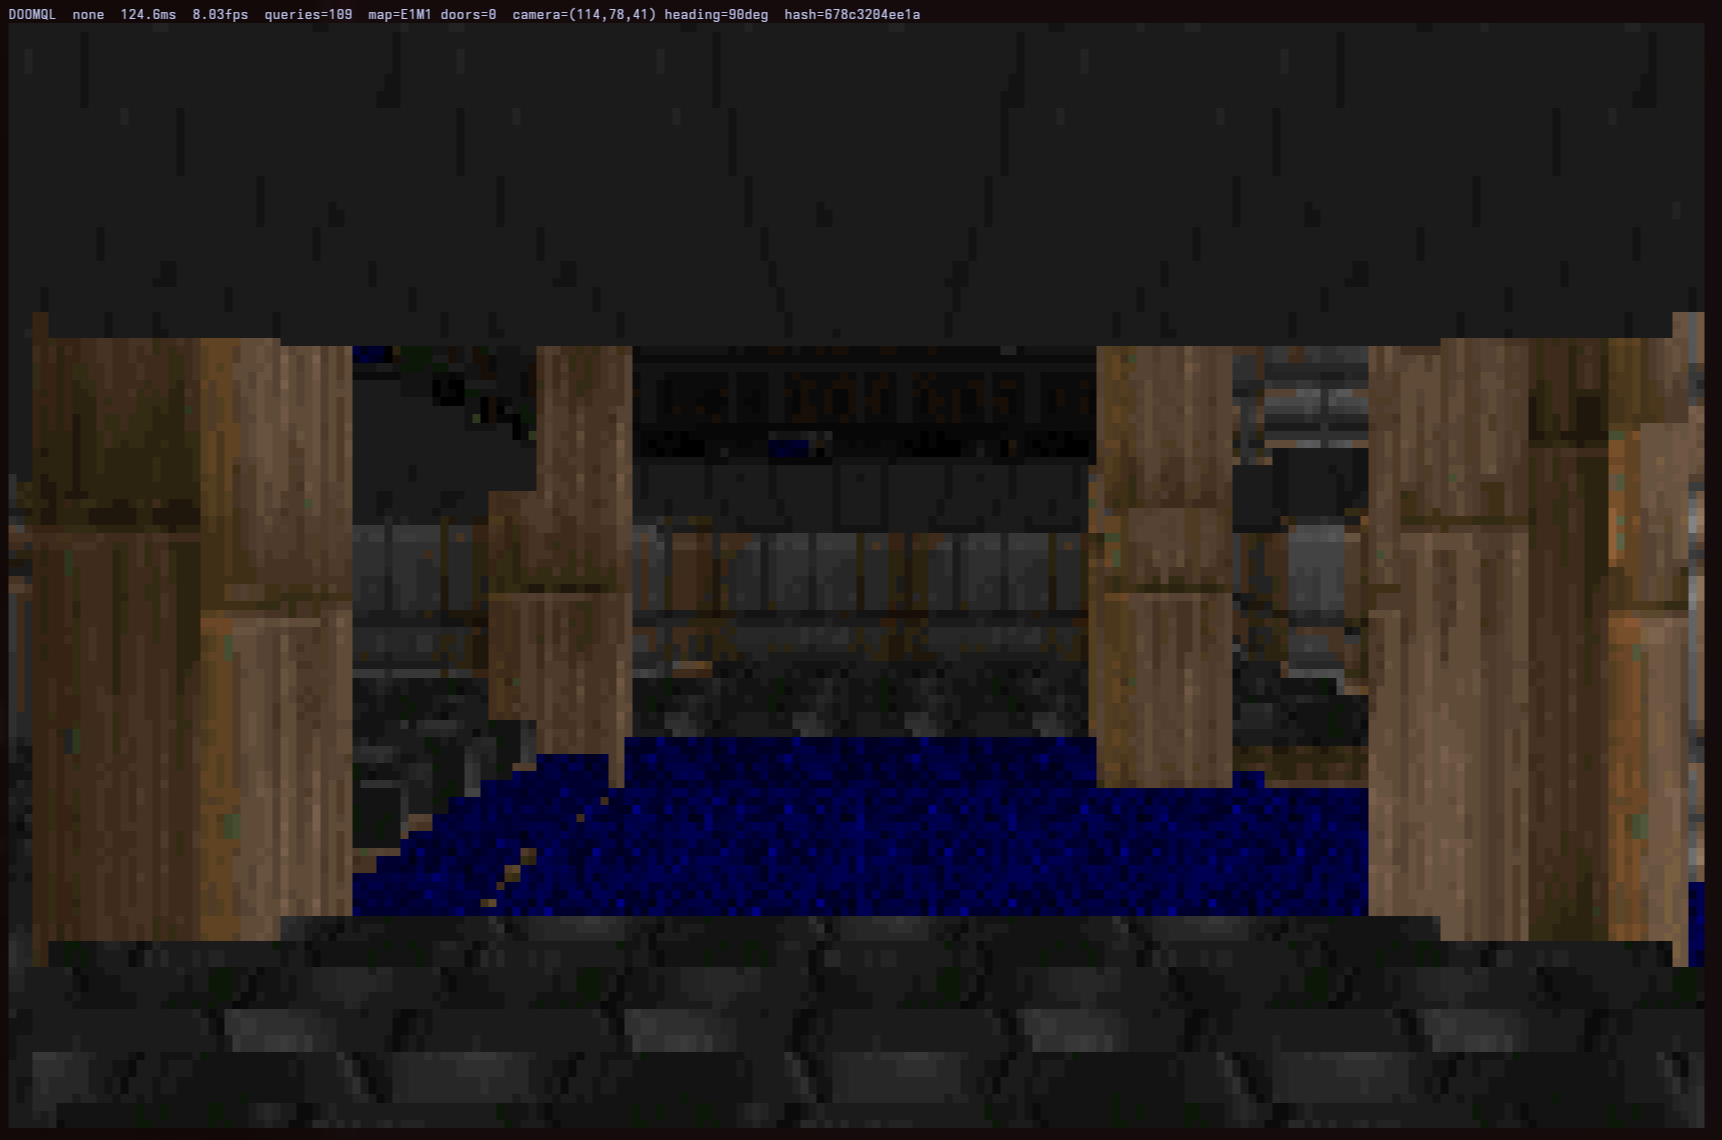
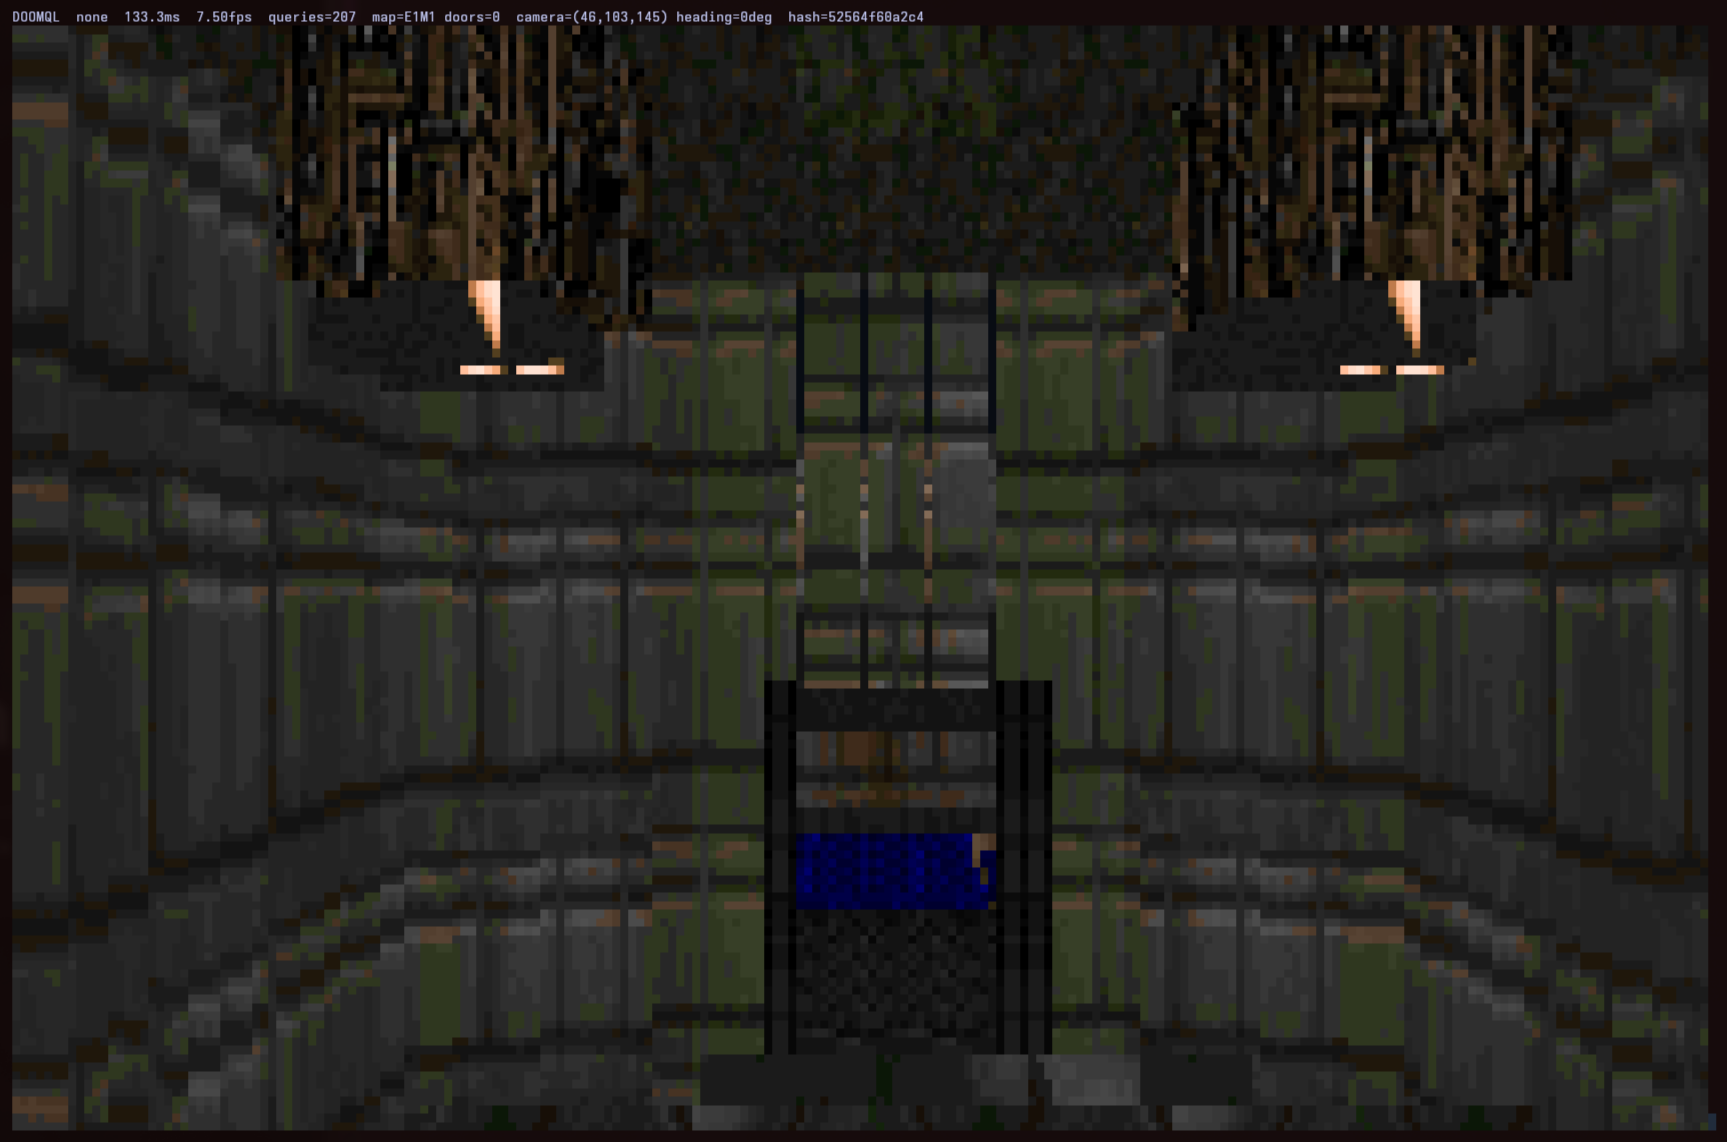
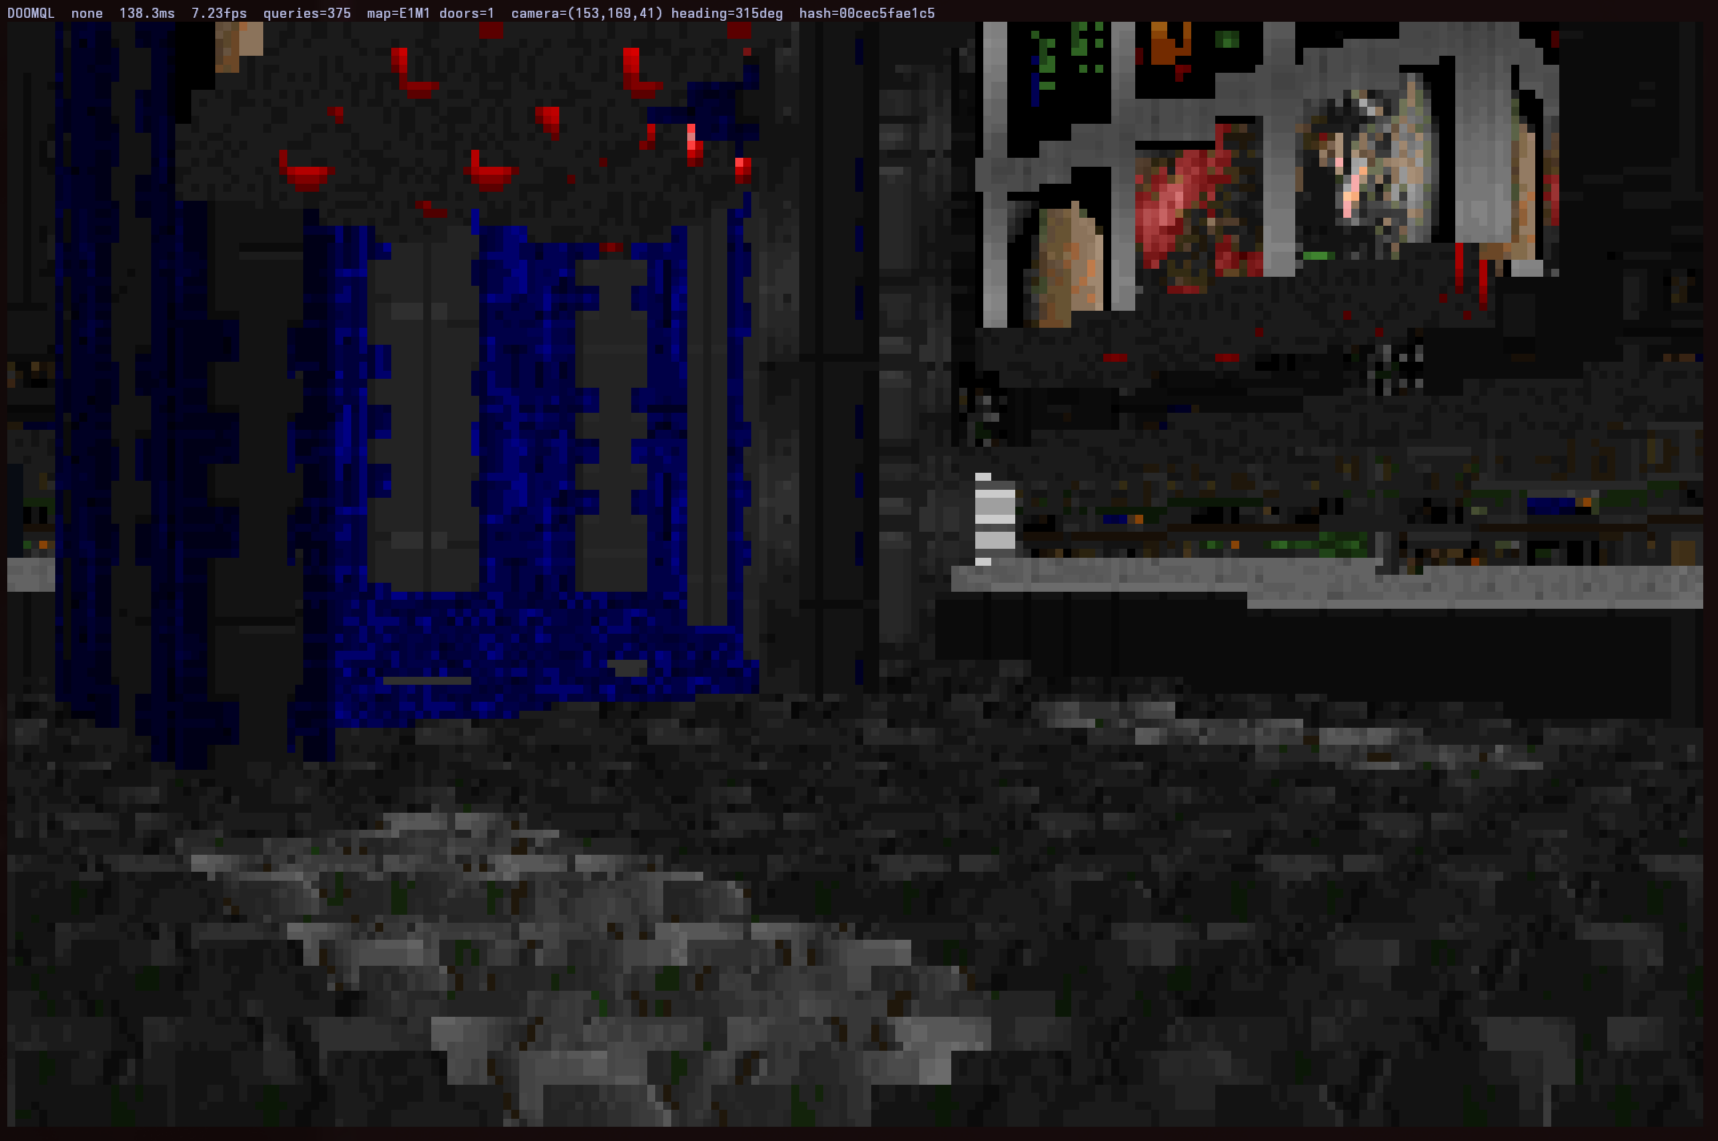
120×40 terminal frame, one query each
1 · The world is a table
Real Episode 1 geometry from the shareware WAD, expanded into repeated observations of a 256×256×16 voxel volume — 1,048,576 rows per complete observation. 5M to 200M rows total.
2 · Each frame is a query
Fixed-point camera vectors rotate the world into camera space; a frustum clip keeps what is visible; a GROUP BY reduces observations to the nearest surface per ray. Camera position changes selectivity every frame.
3 · The terminal shades it
Returned surface strips become shaded wall slices. Every engine must produce the same frame hash — the HUD prints it live, and parity is checked on every run.
WITH camera_space AS ( -- rotate world into camera spaceSELECT surface_id, depth_scaled, lateral_scaled,
z_bottom, z_top, surface_kind, material,
effective_light, sector_id
FROM doomql_episode1
WHERE map_name ='E1M1'AND world_x BETWEEN cam.x - draw_dist AND cam.x + draw_dist
AND world_y BETWEEN cam.y - draw_dist AND cam.y + draw_dist
), visible_space AS ( -- frustum + draw-distance clipSELECT*FROM camera_space
WHERE depth_scaled BETWEEN near AND far
AND lateral_scaled * focal
BETWEEN-half_w * depth_scaled
AND half_w * depth_scaled
)
SELECT lateral_scaled, depth_scaled, z_bottom, z_top,
surface_kind, material, sector_id,
avg(effective_light) AS avg_light,
count(*) AS samples, surface_id
FROM visible_space -- reduce observations to visible surfacesGROUPBY lateral_scaled, depth_scaled, z_bottom, z_top,
surface_kind, material, sector_id, surface_id
ORDERBY depth_scaled, lateral_scaled, surface_kind, surface_id;
The router shifting gears: nobody told it the world grew. It moves from the Vortex layout to the vector path as scan cost overtakes per-query overhead — each frame is routed like any other query.
System
5M rows
15M rows
50M rows
100M rows
200M rows
RVBBIT Auto
44.4ms
70.8ms
153ms
195ms
345ms
RVBBIT Native
107ms
233ms
690ms
996ms
1.87s
RVBBIT Duck Vector
98.2ms
141ms
145ms
189ms
339ms
RVBBIT Duck Vortex
39.7ms
53.1ms
96.7ms
170ms
350ms
RVBBIT DataFusion Vector
89.6ms
136ms
319ms
575ms
1.10s
RVBBIT DataFusion Vortex
121ms
212ms
520ms
961ms
1.85s
DuckDB
35.7ms
59.2ms
71.2ms
97.6ms
185ms
PostgreSQL
127ms
338ms
807ms
1.53s
2.99s
Citus Columnar
133ms
363ms
1.19s
2.42s
4.94s
Hydra Columnar
110ms
193ms
582ms
1.17s
2.33s
AlloyDB Omni
217ms
583ms
2.06s
4.16s
8.64s
ClickHouse
32.8ms
44.3ms
99.2ms
176ms
323ms
Standalone DuckDB reads the exact source Parquet in-process — the most favorable possible setup, kept as an honest baseline. AlloyDB numbers at 100M+ exceed its 4GB columnar pool and degrade toward its row store. Full per-run JSON lives in bench/doomql/results/.
Why it exists
What the weird benchmark caught
four real engine bugs in one week
Every Duck query ran twice
Symptom: Frame times were exactly 2× what engine telemetry reported.
Cause: A root-owned Arrow IPC temp dir made a chmod fail, silently killing the Arrow result path after execution — every sidecar query re-ran through JSON.
Fixed in the sidecar; every duck-routed query on the box got faster.
Two ghost fleet workers
Symptom: A fixed per-frame overhead that no engine could explain.
Cause: Stale fleet_endpoints rows fired a doomed remote dispatch — plus an ORDER BY random() catalog query — on every duck query, during weeks of benchmarks.
Fleet dispatch now requires a configured token, and failed endpoints retire themselves.
11µs per output row
Symptom: 15.5ms of engine work arrived 103ms later at 8K rows per frame.
Cause: The Arrow → jsonb → tuple result path taxed every returned row. Aggregate benchmarks return a handful of rows and never noticed; a renderer returns thousands per frame.
rvbbit._engine_rows now decodes Arrow straight to typed Datums. Frames went 111 → 40ms — and ClickBench geomean dropped 46 → 41ms, TPC-DS 278 → 223ms. A Doom benchmark made TPC-DS 20% faster.
GPU crash cascade
Symptom: Forced-GPU frames didn't get slow — they took the whole database down.
Cause: In a container where postgres runs as PID 1, a crashing GPU engine process re-parents to the postmaster, which treats it as shared-memory corruption and restarts the cluster.
Run GQE containers with docker --init, plus stale shared-memory cleanup in the auto-start path.
The thesis: aggregate benchmarks measure throughput and return a handful of rows, so fixed per-query costs vanish into the noise. A renderer chasing a frame budget measures everything else — dispatch overhead, result materialization, transport, route quality — thirty times a second, with a hash check on every frame.
Frames
Straight from the terminal
HUD shows live frame time, query count, and frame hash
Real Doom Episode 1 geometry (shareware WAD). Not the 16×16 recursive-CTE demo — DoomQL stores repeated observations of a 256×256×16 voxel volume, sized to exercise an OLAP storage layer.
Deterministic replay tours: recorded keypresses, fixed-point camera math, identical frames across engines — every frame hash is compared, every run.
RVBBIT auto uses the default learned router; forced rows pin one engine/layout. PostgreSQL, ClickHouse, and Hydra receive the same SQL over their own connections.
Run it yourself: python3 bench/doomql/load.py --rows 5000000 then python3 bench/doomql/run.py in the rvbbit repository — interactive WASD mode included.