Data Rabbit
Data Rabbit
The desktop UI - a local-first SQL desktop for any Postgres that lights up on an RVBBIT database.Data Rabbit has a site of its own now — screenshots, field notes, and the quickstart live at datarabbit.com. This page stays the deep reference.
Data Rabbit is RVBBIT's desktop: a fast, local-first SQL client for Postgres
built around a windowed canvas instead of tabs. It works against any
Postgres - browse, query, chart, monitor - and when it detects the pg_rvbbit
extension on a connection, the whole rvbbit surface lights up: operator
studios, receipts and costs, adaptive routing, the knowledge graph, cubes,
metrics, capability deployment, and more.
Get it#
Three ways to run the same app:
-
Native macOS app (Apple silicon) — signed and notarized, no Docker required:
https://rvbbit.ai/dist/mac/DataRabbit-4.1.6-arm64.dmg
sha256: f5926145edb52b9648747e96cd117ef2b009c0d6850a897e9c1035afbf081552
The
.appbundles its own Node runtime and serves the desktop on a stable private origin (127.0.0.1:43129), so scenes, saved views, and assistant history survive relaunches. Connections and homebase state live in~/Library/Application Support/Data Rabbit/. All you need is a reachable Postgres; Docker is used only if you install capabilities that launch containers. Requirements and architecture notes live in the repo'sdocs/MACOS.md. -
Native Linux app (x86_64) — AppImage (
chmod +xand run) or.deb:https://rvbbit.ai/dist/linux/DataRabbit-4.1.6-x86_64.AppImage https://rvbbit.ai/dist/linux/DataRabbit-4.1.6-amd64.debChecksums sit beside each artifact (
.sha256). Same architecture as the Mac app — bundled runtime, stable private origin, state under~/.config/Data Rabbit/. -
The Docker ensemble — ships alongside the warehouse and serves on port
3000; "install" is openinghttp://localhost:3000. -
Bare web app — it is a Next.js app at heart; the container image is published as
ghcr.io/ryrobes/rvbbit-lens(the project's earlier name; the image name follows the rename later).
The macOS shell keeps Node fully isolated from the renderer and drives the
same product actions as the in-canvas menu bar, so browser and .app
behavior cannot drift.
Connections#
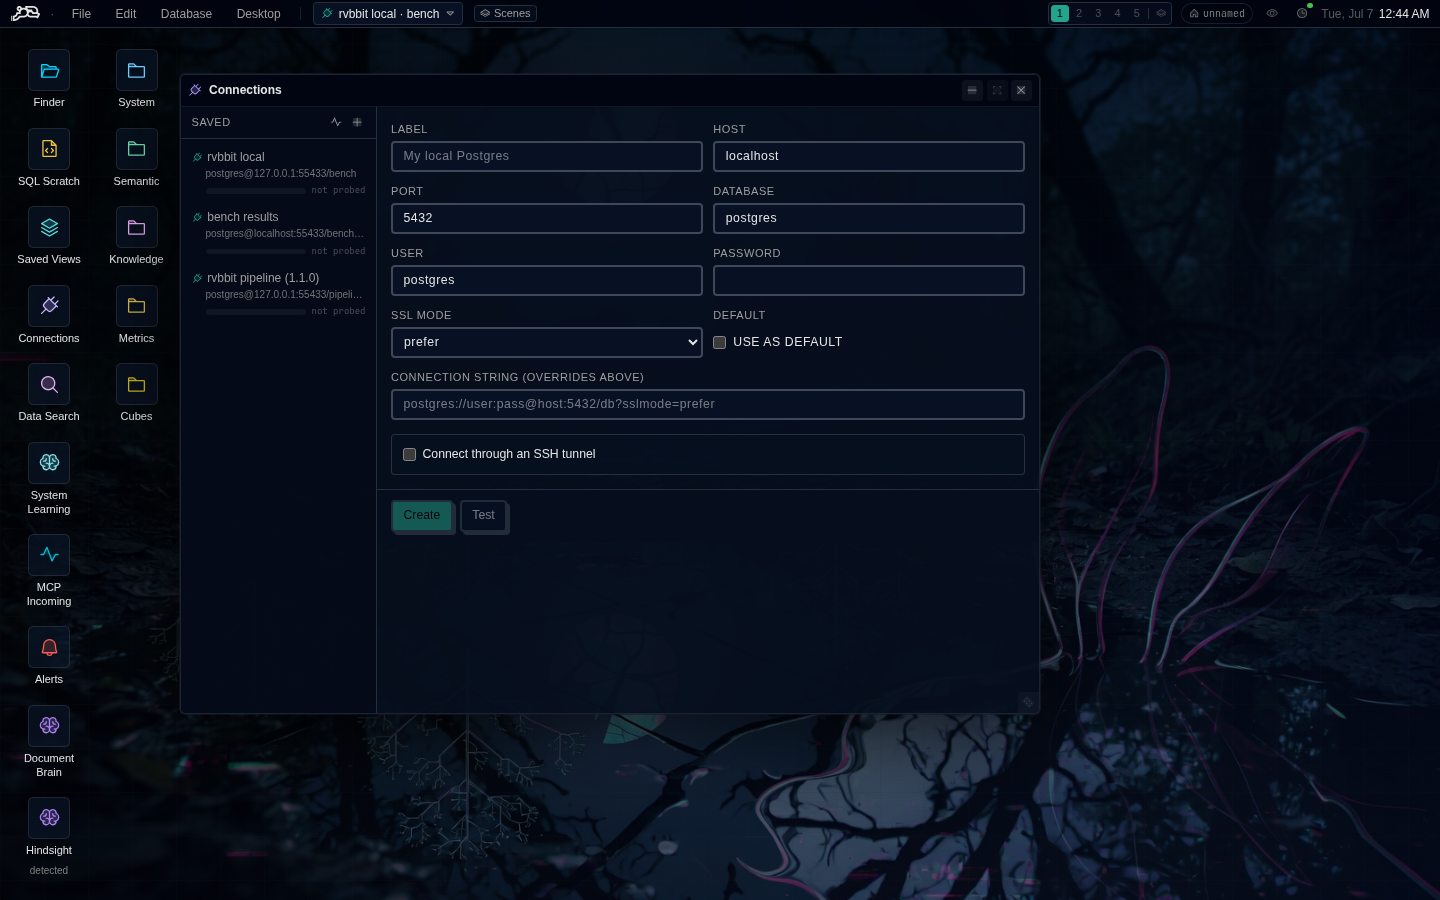
Connections are managed in the Connections window (Database menu →
Connections…). Data Rabbit connects server-side through a pooled pg
driver, so credentials never reach the browser; they are stored in a config
file on the server (connections.json under the app's data directory - a
Docker volume in the ensemble, ~/.config/rvbbit-lens/ on a bare install)
with passwords redacted from every API response.
- Discrete fields (host, port, database, user, password, SSL mode) or a full
postgres://connection string. - Per-connection SSH tunnel support (bastion host, private key or password) for reaching databases behind a jump box.
- A Test connection action that reports schema/table counts before you save.
- The connection picker in the menu bar shows
label · database; anæbadge marks rvbbit-enabled connections.
Two pool lanes keep the UI responsive: interactive queries get the main pool
while monitors and schema fan-out use a small isolated meta pool, so a
runaway dashboard can't starve your query.
Hostnames are resolved by the Data Rabbit server, not your browser. Because connections are made server-side, the host you type is answered from wherever the lens process runs. In the Docker ensemble that means
localhostpoints at the lens container itself - use the compose service name instead: hostpostgres, port5432(not the host-published55433). Conversely, if Data Rabbit runs directly on your machine and you're reaching a remote database through an SSH tunnel, thenlocalhost:<tunnel-port>is exactly right - the tunnel lives where the server lives.
The Desktop#
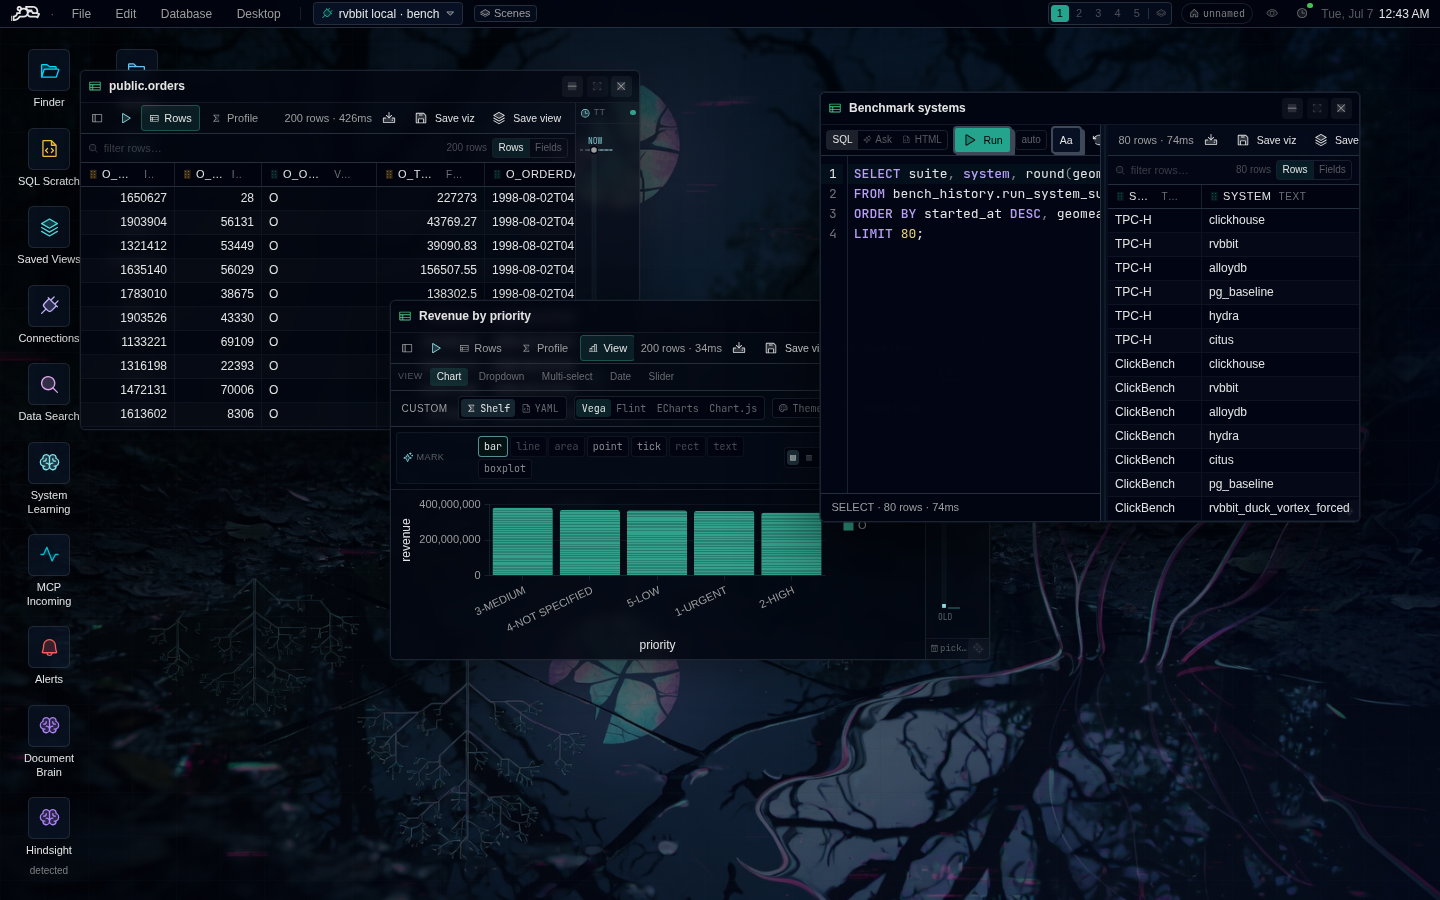
Windows live on an infinite pan/zoom canvas. Each window is draggable, resizable, and minimizable, and the desktop itself is a first-class object:
- Workspaces - five scratch workspaces plus a Scene slot, switched with
Alt+1…5andAlt+6. Occupancy dots in the menu bar show which are in use. - Scenes - named, saveable desktops (Save / Save As / Open / Rename / Delete from the Scene tray). Scenes can be shared and forked between "homes".
- Persistence - the desktop persists locally first (browser storage) with a server-side shadow (SQLite), so state survives restarts and can follow a shareable home URL.
- Present mode - a read-only toggle that strips window chrome and editor rails and fits the canvas to the screen, for demos and wall dashboards.
- Theming - light/dark themes, a full Palette editor (Desktop menu →
Palette…) over the OKLCH design tokens, and wallpaper support that can derive an accent palette from the image - including an optional vision-model path that themes the whole desktop from your wallpaper. - Fonts - Desktop menu → Font: sans family, mono family, and UI size.
- Dependency lines - an optional overlay that draws curves between SQL windows that reference each other, so the reactive graph is visible.
SQL Windows#
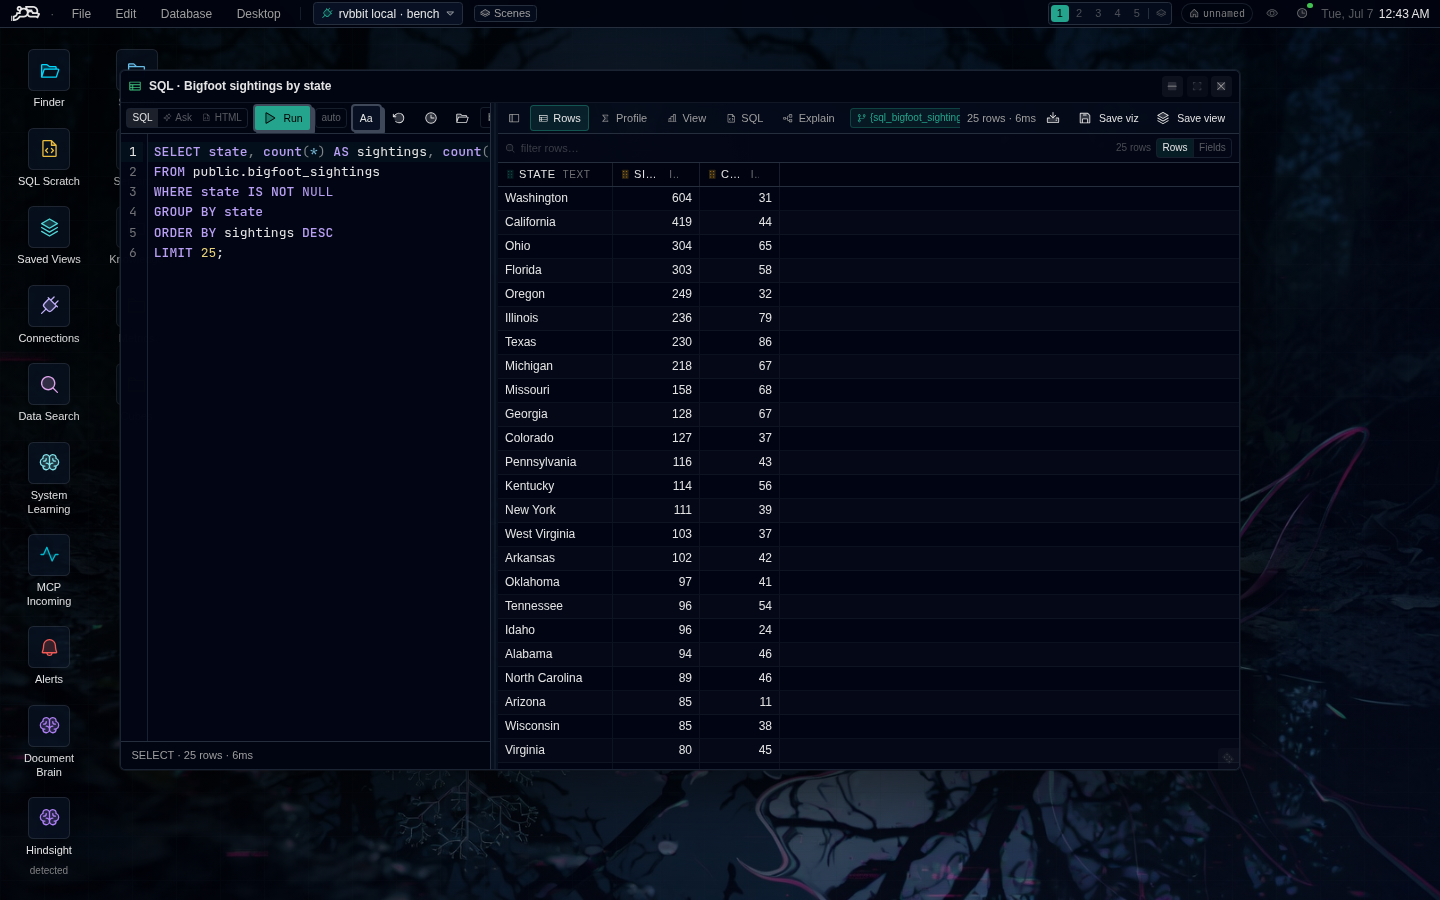
⌘N (File → New SQL window) opens the core surface: a CodeMirror SQL editor
with completion and formatting over a virtualized result grid.
- Run with
⌘↩; transaction controls (BEGIN/COMMIT/ROLLBACK); per-window query history; open a.sqlfile from disk. - Body tabs:
rows(grid),profile(column profiling),chart,sql,explain(visual plan graph),steps(semantic-operator step trace after a Cascade runs), andapp(SQL-authored dashboard artifacts). - Export: CSV, JSON, copy as
INSERTs, plus "Save as view" and "Save as canonical viz block" on rvbbit connections. Large results page in with "Fetch 5000 more rows". - Ask mode - type plain English; the window generates SQL through
rvbbit.synth_sqland shows the query before running it. - HTML Block mode - chat-author an HTML app backed by named SQL queries
(
rvbbit.html_block_turn), rendered live in theapptab.
Reactive Blocks And Params#
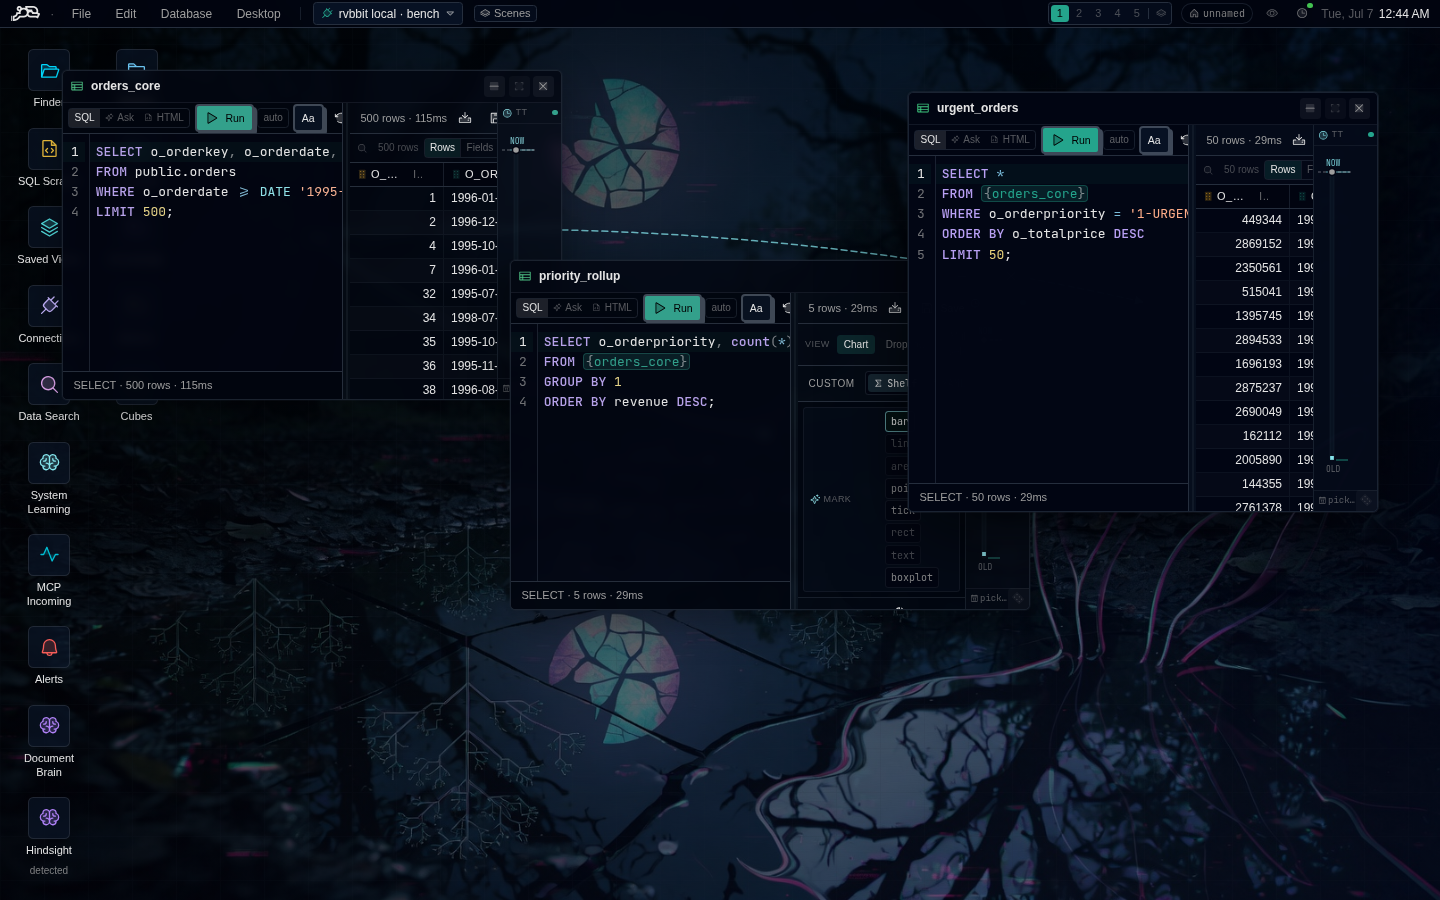
Every SQL window has a block name, and any other window can reference it
as {block_name} - rewritten at run time as an inline subquery. Clicking a
cell in a grid (or a mark in a chart) emits a filter param onto the
workspace; windows subscribed to that param re-run automatically, and
filtering an upstream block cascades into every downstream reference. Block
chips are draggable: drop one on the canvas to spawn SELECT * FROM {block},
or onto a rollup tile to pipeline it.
This is the desktop's quiet superpower: a handful of small SQL windows compose into a live, cross-filtered dashboard without a dashboard builder.
Charts#
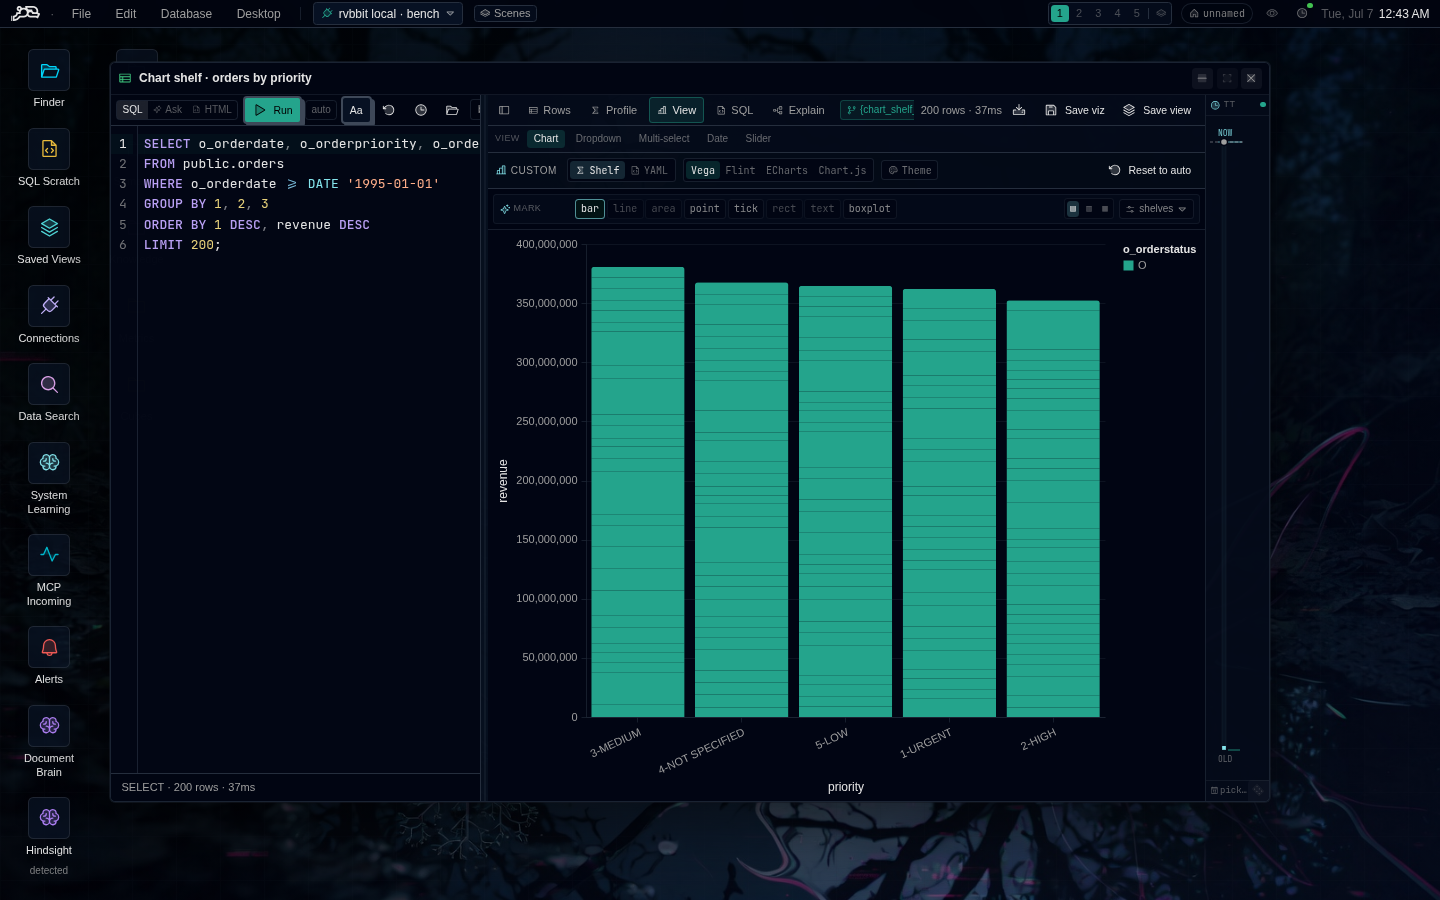
The chart tab auto-infers a Vega-Lite spec from your result columns, themed
from the active palette. Two editors sit on top:
- Chart shelf - a Tableau-style drag-and-drop shelf editor (fields onto x/y/color/size shelves, aggregate and time-unit pickers) that round-trips with the underlying Vega-Lite spec; an "Edit spec" YAML pane is always available for full control.
- Rollup shelf - drag column chips onto group-by / measure / pivot / top-N tiles to generate aggregation SQL, including semantic-operator measures on rvbbit connections.
Chart marks participate in the param system - clicking a bar filters downstream windows, same as clicking a grid cell.
Time Travel Scrubber#
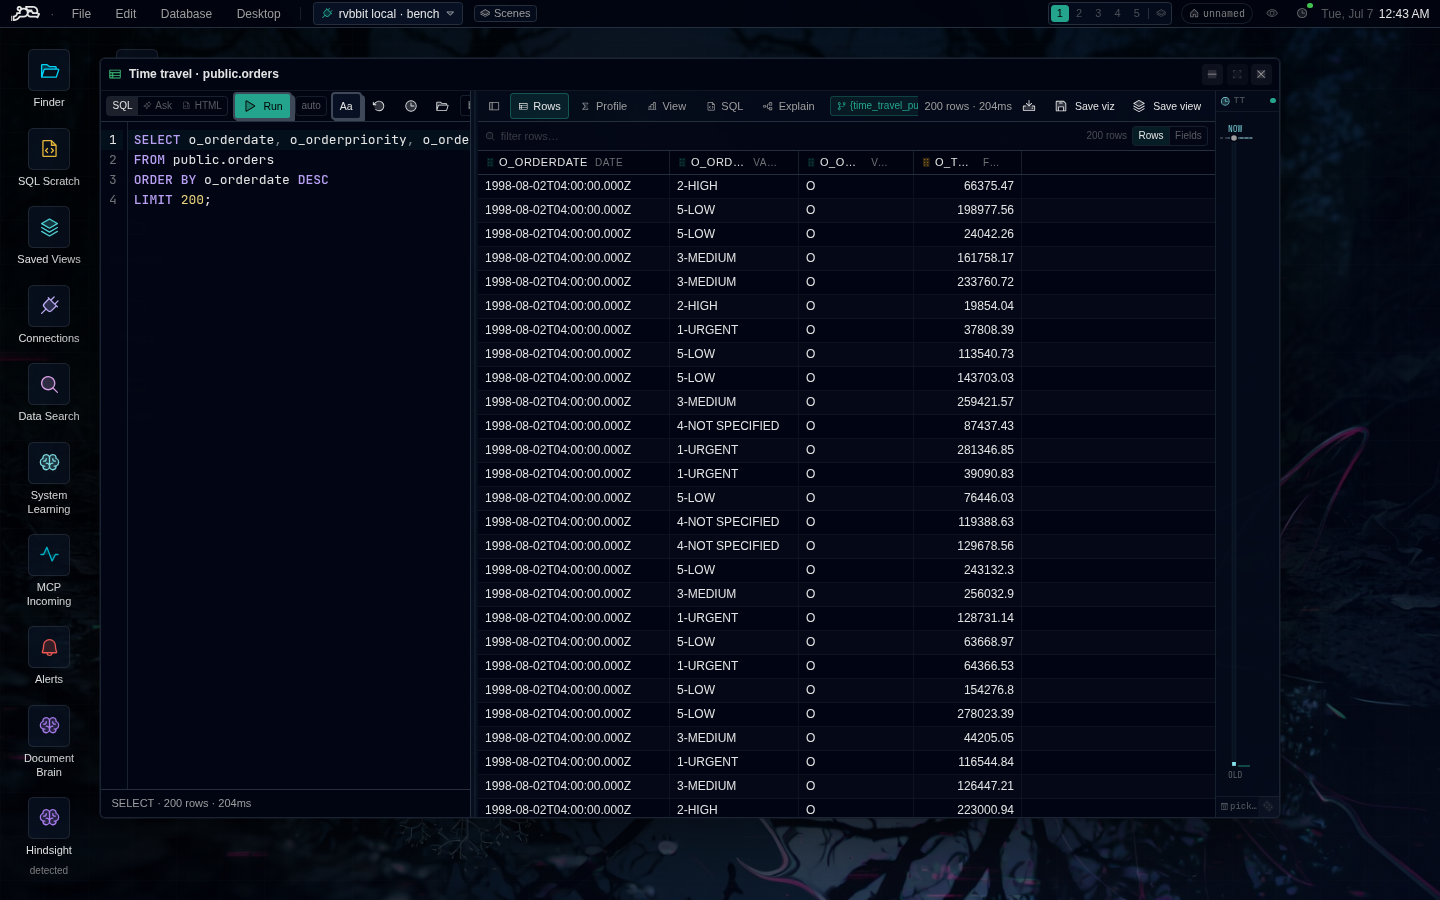
On an rvbbit connection, tables registered for
acceleration get a time-travel scrubber: a
strata-style timeline of the table's generations (built from
rvbbit.time_travel_timeline, so it never scans data). Drag the handle to
pin the window to an AS OF moment - the editor is rewritten with the
-- rvbbit: as_of = '…' comment and re-run - hover ticks for snapshot cards,
or type an exact datetime. See Time Travel.
Finding Things#
- Command palette (
⌘P) - fuzzy quick-open over tables, saved views, windows, and tools. - Scry (
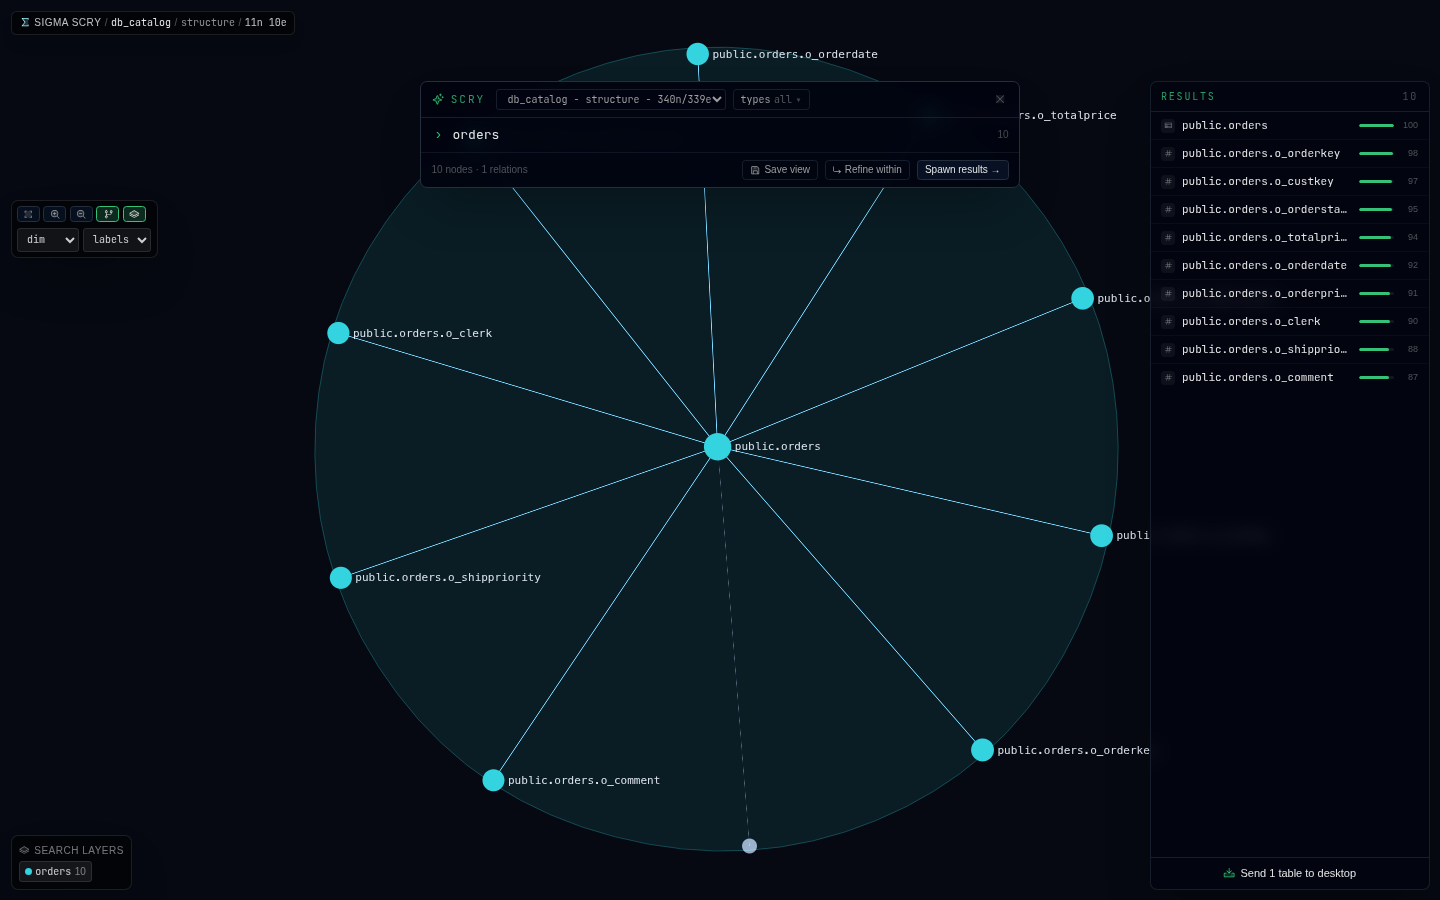
⌘K) - a full-screen semantic search canvas. Each search stage scopes within the previous stage's results ("tables about shipping … within those, columns about delay"), and editing an upstream stage re-flows everything downstream. Results spawn into data windows. - Finder (
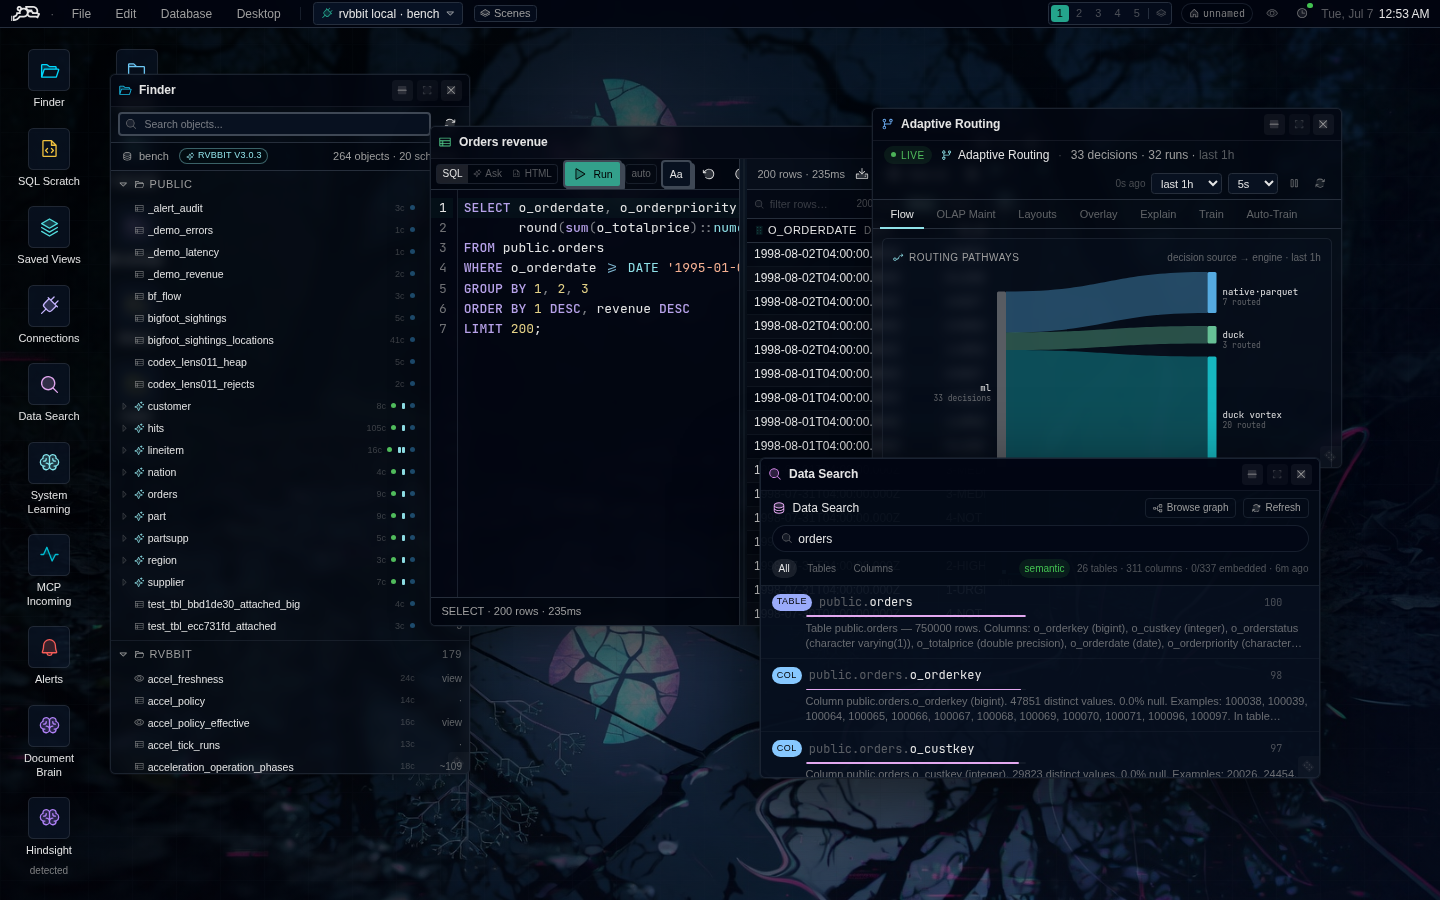
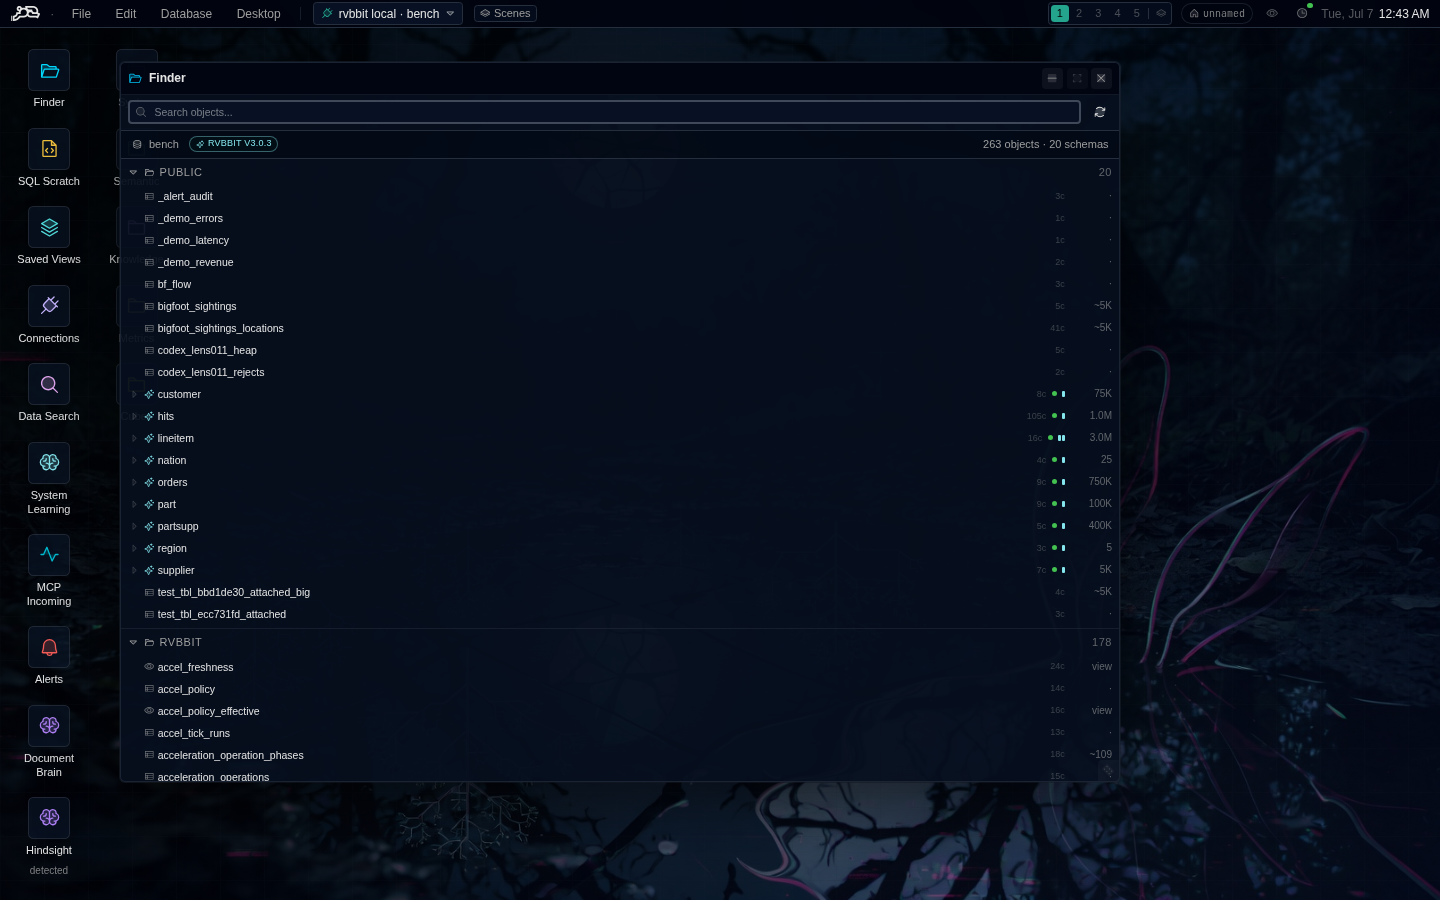
⌘F) - a schema tree grouped by namespace with search, DDL view, and inline table-activity sparklines. - Data Search - free-text semantic search over the catalog, ranking tables and columns by what their data is about.
The RVBBIT Cockpits#
On an rvbbit connection the Database menu grows a full set of windows, each a thin, live view over the SQL surfaces documented elsewhere in these docs:
| Window | Over | Docs |
|---|---|---|
| Receipts / Costs / Cache | rvbbit.receipts, cost ledgers, embedding/result caches |
Receipts And Costs |
| Operator Studio | rvbbit.operators - author, inspect, and try operators on a canvas, with step graphs and receipt timelines |
Semantic SQL, Cascades |
| Specialists / Model Studio | model backends, training runs, evaluations | Providers, Predictive Models |
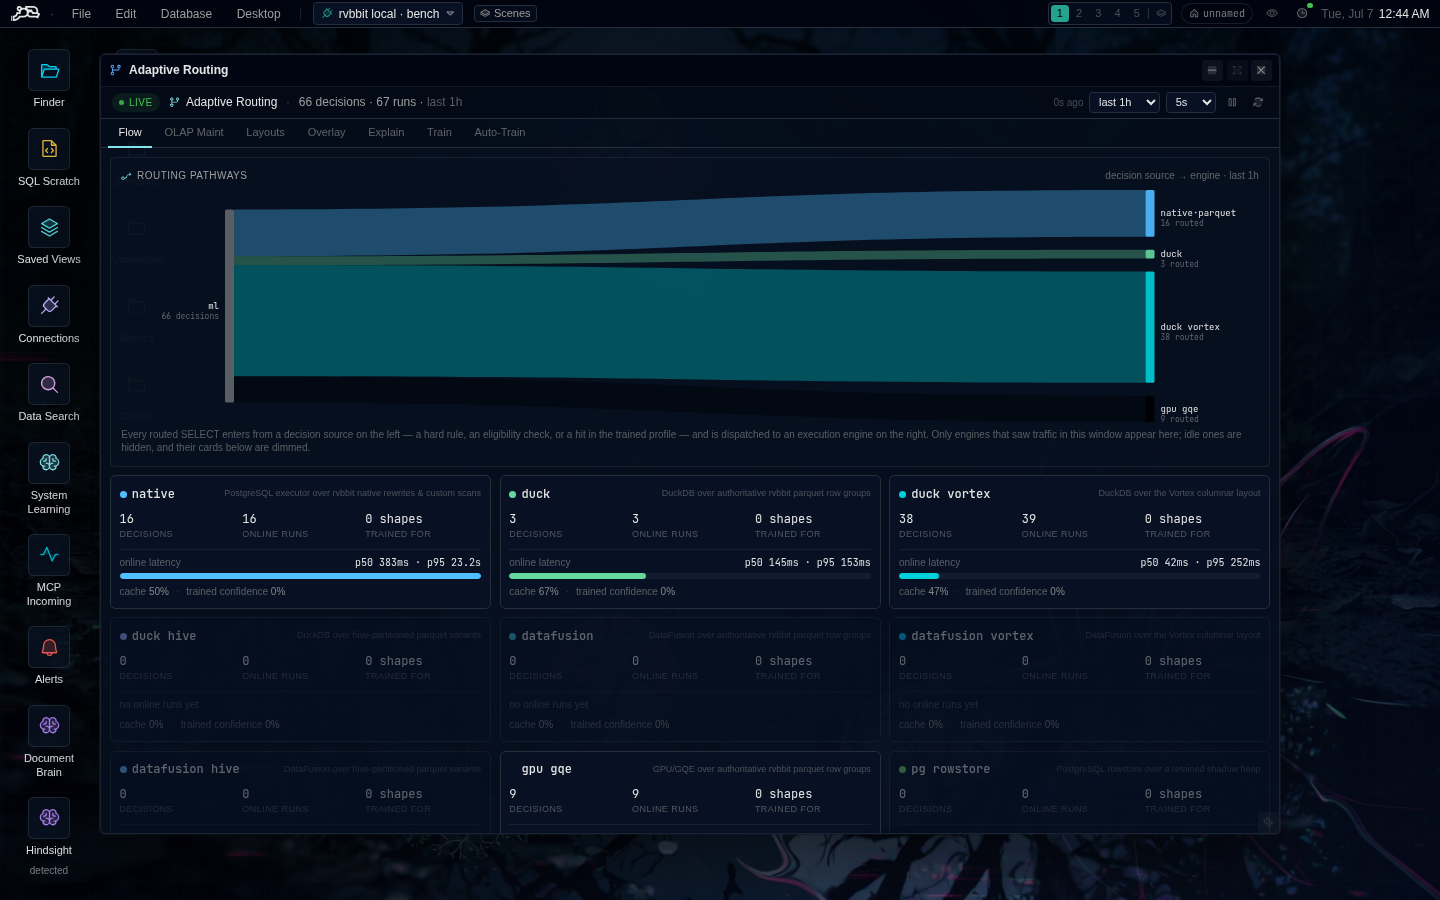
| Adaptive Routing | route decisions, training, profiles, workload layouts, freshness | Routing And Training |
| MCP Servers / MCP Incoming | server registry, tools, invocations; incoming agent traffic | MCP Servers |
| Capabilities | the capability catalog, install graphs, and a Hugging Face deploy flow | Capability Packs |
| Warren | nodes, jobs, deployments | Warren |
| Duck Monitor | Duck/Vortex worker telemetry | Duck/Vortex Worker |
| Knowledge Graph (browser, graph explorer, extraction runs, merge review) | rvbbit.kg_*, with a force-directed graph canvas |
Knowledge Graph |
| Metrics (catalog, creator, inspector, board) | metric definitions, bitemporal history | Metrics And KPIs |
| Cube Studio (catalog, creator, inspector, proposals) | cube definitions, health, enrichment | Cubes |
| Alerts | alert rules, state, queue, firing history | Alerts |
| Drift | catalog drift detection | Catalog |
| Query Lens | per-query drill-down: receipts, lineage, cost | Receipts And Costs |
| Scheduler tray | pg_cron jobs, with one-click presets for the maintenance entrypoints | Accelerator Freshness |
The Metric Inspector is a nice example of the house style: a definition-time version picker on one axis and a data-time time-travel scrubber on the other, so "what did this KPI say, under which rule, over which data" is one window.
Postgres Tools#
The non-rvbbit toolset works on any connection:
- Postgres Monitor - live activity (polling stands down when its workspace is parked).
- Postgres Admin - object management (roles, grants, tables).
- System Objects and Extensions browsers.
- Notification Center -
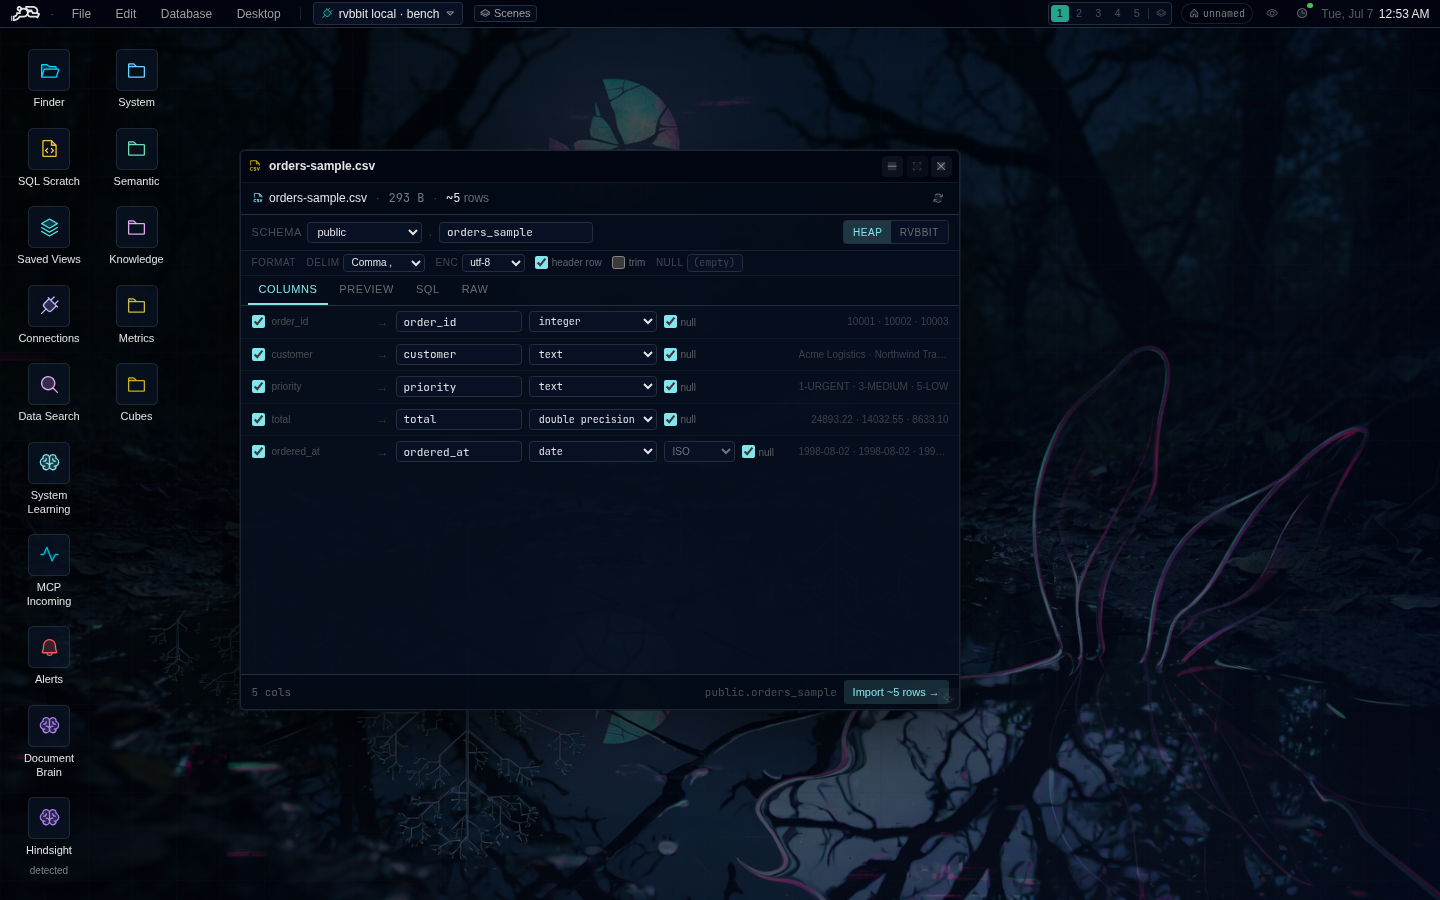
LISTEN/NOTIFYstreamed to toasts and a feed. - CSV Import - streaming multi-gigabyte CSV import with dialect and date format inference and generated DDL.
- View Apps - save any SQL statement as a launchable desktop "app" with its own icon.
SQL-Authored Dashboards#
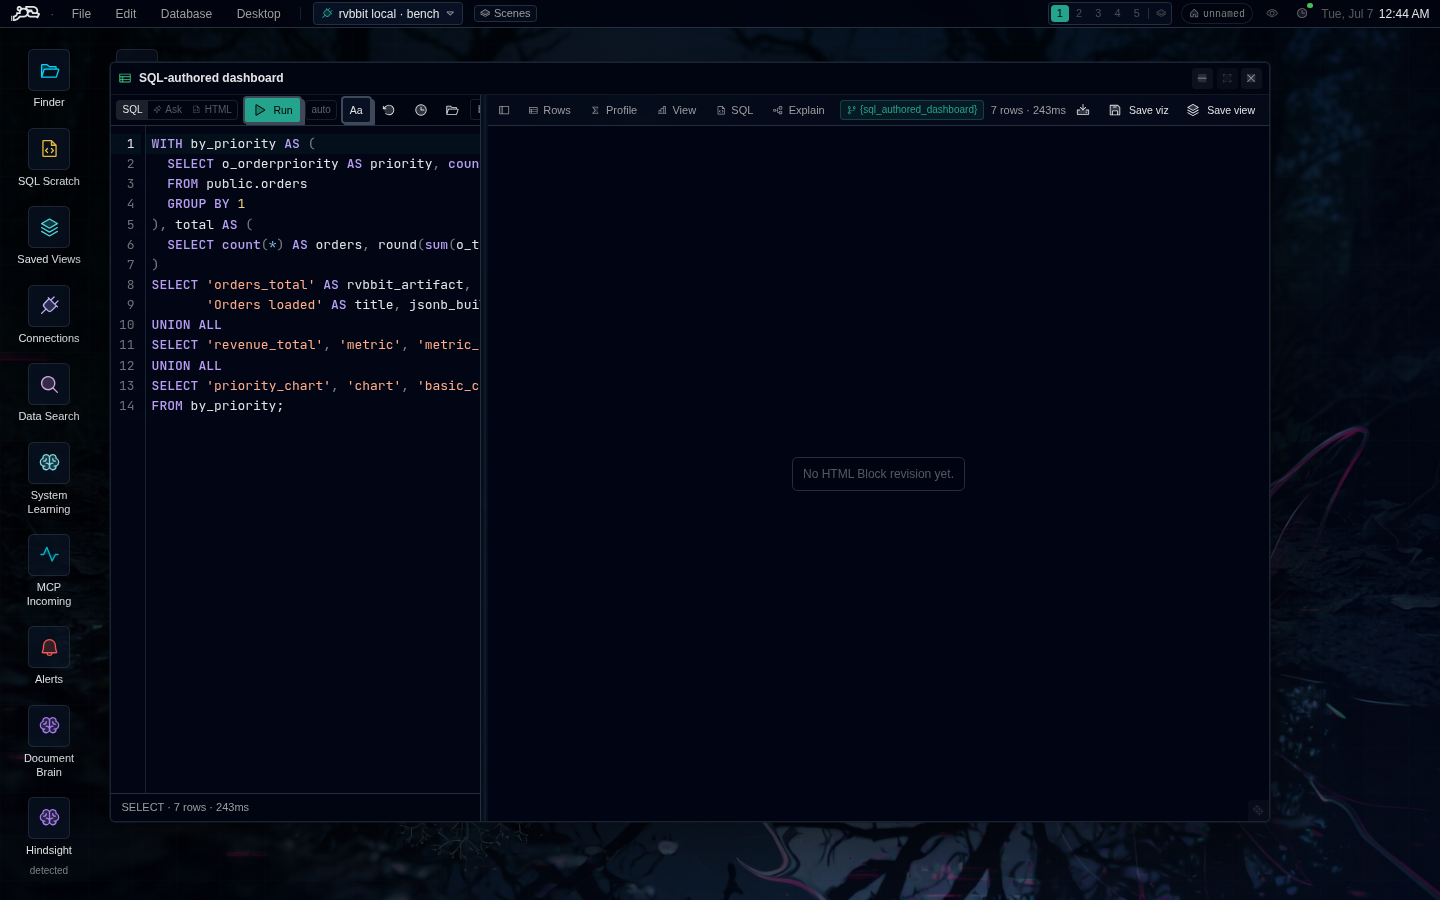
Results can be UI: a statement that returns rvbbit_artifact = 'ui' rows
renders as dashboard tiles - charts, metric cards, KPI gauges, sparklines,
tables, filter controls, action buttons - laid out by weight. Filter controls
bind back into the same param system as everything else. Viz Blocks makes
these reusable: versioned SQL templates stored in rvbbit.viz_block_defs
(rvbbit.define_viz_block, rvbbit.preview_viz_block) that can be linked to
tables and shipped with the database rather than the client. Published
dashboards render in a sandboxed Dashboards window with a read-only query
bridge.
Keyboard Shortcuts#
| Shortcut | Action |
|---|---|
⌘N / Ctrl+N |
New SQL window |
⌘↩ |
Run the focused SQL editor |
⌘P / Ctrl+P |
Command palette |
⌘K / Ctrl+K |
Scry semantic search canvas |
⌘F / Ctrl+F |
Finder (schema browser) |
⌘Z / ⇧⌘Z |
Undo / redo desktop actions |
Alt+1…5, Alt+6 |
Switch workspace / Scene slot |